Enhance your edge trading futures, equities, and other instruments using market-generated information analyzed in real time. No DOM or complicated platform interfaces needed, starting in TradingView.
Seven Dimensions of Market Intelligence. One Decisive Edge
Futures · Stocks · Crypto · ETFs · Forex
7
Analysis Dimensions
2
Primary Decision Support Signals
5
Built-In Preset Configurations
∞
Markets Supported


Most indicators measure price with one math layer and call it a system. We measure the conditions that move price: order flow, regime state, cross-asset correlation, volatility structure, breadth, and structural patterns, all simultaneously. When the dimensions converge, you get a signal. When they don’t, you get silence.
Founding Member — Cascade Pro
Lock in the Founding price on Cascade Pro in exchange for helping shape the product. Founders get full Pro access plus a direct feedback loop with the developer.
Founder commitment: one short feedback form per month (2–3 minutes) + optional feature voting.
All 7 dimensions, regime dashboard, all presets, webhook output — everything in Pro, nothing held back.
$29/mo for as long as your subscription remains active. If Pro pricing increases later, your rate stays the same.
Private Discord channel with the developer. Feedback and bug reports influence what gets built next.
New modules, presets, and asset support — Founders get builds first, often weeks before general release.
Instant checkout · Cancel anytime · Founding rate stays locked while active
Cohort closes: when 50 Founding memberships are claimed or when V2.0 ships (whichever comes first).
This is a distinctive tool to support your trading decisions
The full signal engine drives both long signals and short signals from
seven libraries running simultaneously.
No extra overlays.
No TradingView Premium plan required.
THE PROBLEM
Single-layer indicators offer little more than a single point of failure
Markets move on cascading liquidations, regime shifts, and cross-asset flows. Your indicators should see all of that and not be limited to technical indicators or time and price theories.
Blind to Liquidation Events
Cascading liquidations can move an instrument significantly in seconds. Lagging indicators only tell you after the damage is done.
No Regime Awareness
Taking the wrong side of a regime shift is burning capital by design. Without real-time market analysis, every trade is little more than a coin flip.
Indicator Slot Overload
Stitching together 5–8 separate indicators for flow, volatility, breadth, and structure wastes slots and creates conflicting signals.
Order Flow Analysis
Flow analysis identifies the directional pressure behind each move before price catches up
Market Regime Classification
Classifies the current market state in real time so you always know the environment you're trading in
Market Breadth Integration
Cross-market pressure analysis confirms whether macro conditions support your trade or are diverging beneath the surface.
Volatility Exhaustion Mapping
Identifies price levels where forced liquidations are most likely to trigger. Your edge starts at the extremes
Cross-Asset Correlation
Confirms signal quality by analyzing behavior across related instruments. Divergences trigger early-warning flags
Structural Pattern Recognition
Detects specific price action structures that consistently precede cascading liquidation events.
Higher-Timeframe Alignment
Confirms whether the higher timeframe structure supports or opposes the signal, preventing trades against dominant momentum.
WHAT’S UNDER THE HOOD
Regime Intelligence Layer — Macro Flow Pressure (MFP)
MFP classifies the live market regime by analyzing tech, fiat, volatility term structure, gold, crude, and yield curve dynamics. It doesn't add a score; it modulates every score. Favorable regimes lower thresholds and boost confidence. Hostile conditions tighten filters, reduce position sizing, and can block signals entirely. This is the layer that prevents you from taking the right trade in the wrong environment.
HOW TO USE IT
01
Add the Indicator to Any Chart
Drop Liquidation Cascade - Core or Pro onto any TradingView chart: futures, stocks, ETFs, forex, and other markets. Select one of five (Pro Plan) built-in presets or customize every parameter to provide confluence to your edge.
02
Receive Scored Signals
When multiple analysis dimensions converge, LCD fires a scored signal with a regime-adjusted confidence multiplier. High scores mean high confluence. Get alerts via TradingView, email, or webhook.
03
Execute with Confidence
Trade manually using Liquidation Cascade on-chart signals and regime dashboard. Every signal includes the composite score, market regime state, and position sizing tier so you can make fast, informed decisions.
Let’s compare the two plans…
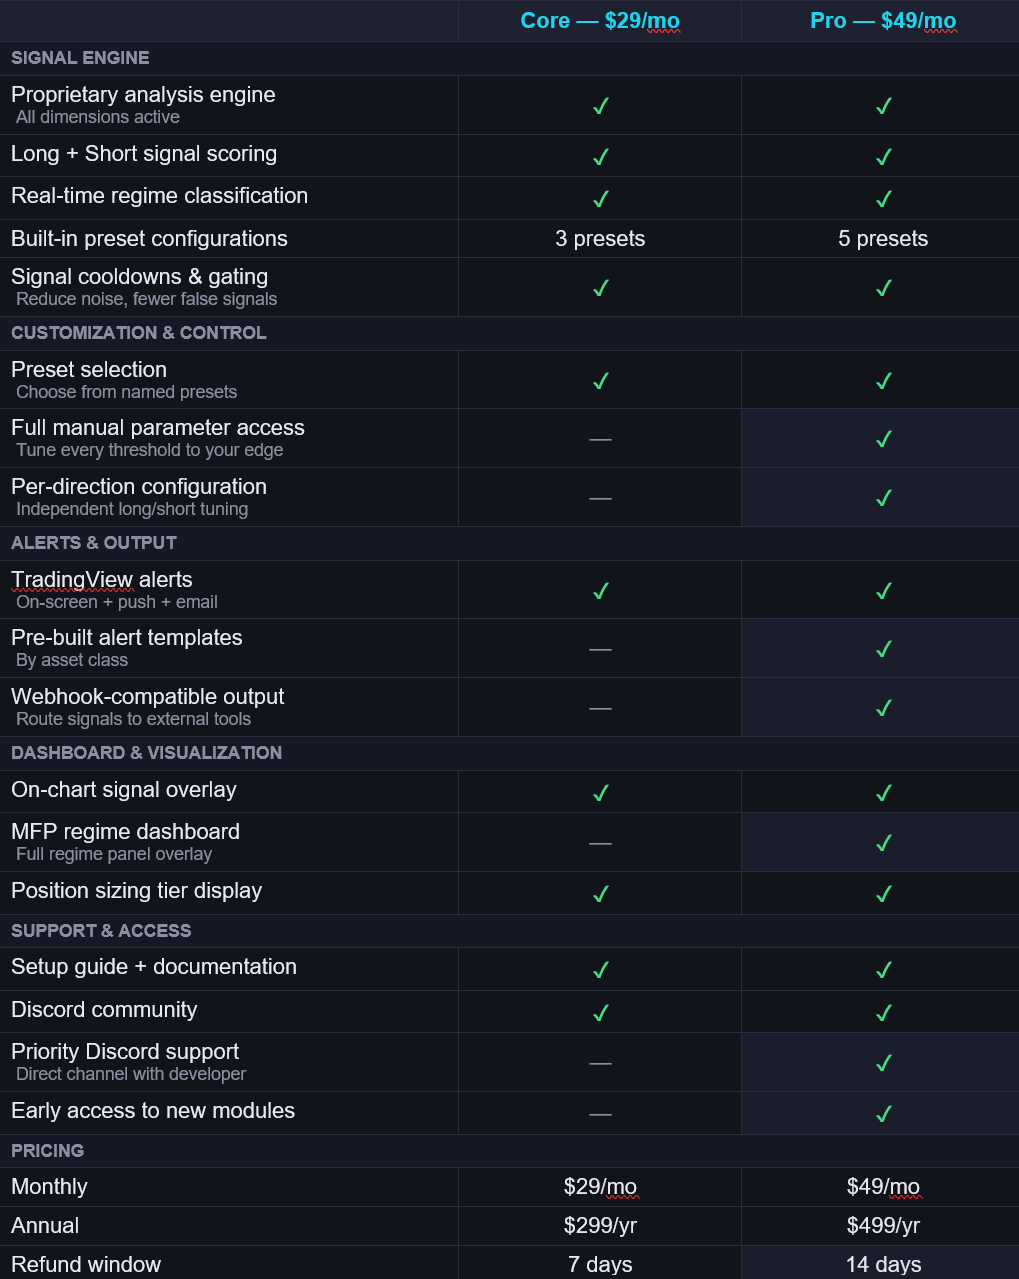
- Cascade Indicators Engine
- All 7 analysis dimensions
- 3 configuration presets: scalp, intraday trend fade, mean reversion
- Real-time regime classification
- Setup guides + video tutorials
- Everything in Core system
- Two additional options — aggressive scalp and swing
- Full ability to manually adjust settings
- Pre-built alert templates by asset class
- Regime dashboard overlay
- Discord community access and priority support
- Early access to new features
- $49/mo value → $29/mo for life while your subscription stays active
- Everything in Core system
- Two additional options — aggressive scalp and swing
- Full ability to manually adjust settings
- Pre-built alert templates by asset class
- Regime dashboard overlay
- Discord community access and priority support
- Early access to new features
- Founders commit to one 2-min feedback form per month. That's the deal.
Annual plans available — save ~15%.
See annual options →
· All prices USD · Requires TradingView Essential or above.
Educational tool only — not financial advice. Past performance is not indicative of future results.
Still not sure?
Try Liquidation Cascade - Basic
See the foundation of the Liquidation Cascade engine — for free. Four core analysis modules score liquidation cascade signatures in real time on any TradingView chart. No signup, no paywall, no invite needed.

STOP GUESSING. START DETECTING.
Seven Dimensions of Confluence.
One Indicator Slot. One Decision.
Every day you trade without regime awareness and liquidation detection is a day you're leaving edge on the table. LCD was built to fix that.
Our first product in the Cascade Indicators intelligence platform is the Liquidation Cascade Detector. More instruments and analysis tools are in development.
Risk Disclosure: Trading involves substantial risk of loss and is not suitable for all investors. Past performance is not indicative of future results. Cascade Indicators products are analytical tools for educational purposes and do not constitute financial advice. No representation is made that any account will achieve profits or losses similar to those discussed. You should consult with a qualified financial advisor before making any trading decisions. Hypothetical or simulated performance results have inherent limitations. Unlike an actual performance record, simulated results do not represent actual trading. Also, since the trades have not been executed, the results may have under-or-over compensated for the impact of certain market factors, including lack of liquidity. As a provider of technical analysis tools, we do not have access to the personal trading accounts or brokerage statements of our customers. As a result, we have no reason to believe our customers perform better or worse than traders as a whole based on any content, tool, or platform feature we provide.
© 2026 Cascade Analytics LLC. TradingView® is a registered trademark of TradingView, Inc. TradingView has no affiliation with the owner, developer, or provider of the services described herein.